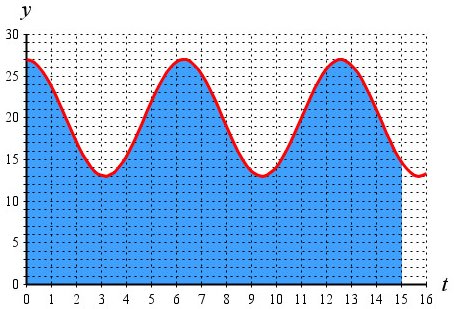
How far does an object travel in 15 seconds if its velocity is given by the function v(t) = 20 + 7 cos t ft/sec? It helps to recall that we can represent the distance traveled by the area under a velocity curve. Let's look at a graph where t is the horizontal axis and y = v(t) is the vertical axis. The time units are in seconds and the velocity units are feet per second (ft/sec).
In the following graph, the red curve represents the velocity function. As we can see, the traveling object alternately slows down and speeds up (the effect of the cosine term), never going more slowly than 13 ft/sec and never going faster than 27 ft/sec. The area under the curve for time values between t = 0 and t = 15 (in blue) represents the distance traveled, if only we could figure it out. Learning how to do that is one of the goals of calculus. However, it's not too difficult to get a rough estimate.
 In the second figure, I've drawn in the lines y = 13 and y = 27 to mark off the low and high points of the velocity curve. If the object were traveling only 13 ft/sec for 15 sec, then the distance it travels would be just (13 ft/sec)(15 sec) = 195 ft. That's the area of the blue rectangle that represents a lower bound on the area under the red curve. On the other hand, if the object always traveled 27 ft/sec (the upper bound on velocity), then the distance traveled would be (27 ft/sec)(15 sec) = 405 ft.
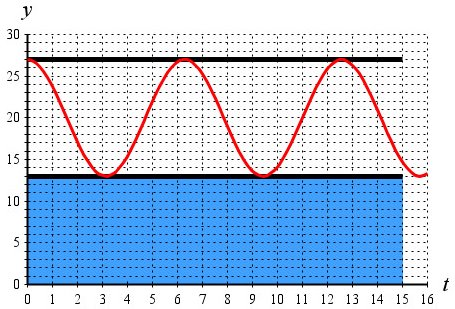 We have now figured out that the distance traveled is somewhere between 195 ft and 405 ft. That's a pretty broad range, to be sure, but we could make it better by using less extreme bounds. For example, we could try drawing triangles inside the humps of the cosine curve to estimate the area we left off while computing the lower bound. That should help. At some point, though, we would probably want something better than computing lots of different estimates. When we have the right calculus tools available, we'll be able to show that the exact distance traveled is 300 + 7 sin 15 ≈ 304.55 ft.