Pollsters usually examine a sample that is much smaller than the actual
population in question. For a statewide election in California, for
example, a pollster is likely to interview a few hundred voters to
discover the opinions of an electorate that comprises millions. How can
this possibly work?
A sample example
A small sample can give you a surprisingly robust measure of what is
going on with a large population. As long as the pollster takes some
practical measures to ensure that a sample is not unduly skewed (don't
find all your polling subjects in the waiting rooms of Lexus
dealerships!), the sample will be representative of the whole
population. That's why you'll hear people talk about picking people at
random in a polling survey. It's a way to avoid biasing a sample.
Suppose, for the sake of illustration, that a voting population is
evenly divided between candidates A and B. Suppose that you're going to
pick two voters at random and ask them who they prefer. What could
happen?
There are actually four possible outcomes: Both subjects prefer A, both
subjects prefer B, the first subject prefers A while the second prefers
B, and the first subject prefers B while the second prefers A. These
four outcomes are equally likely, leading us to an interesting
conclusion:
Even a sample of size 2 gives you a correct measure of voter preference half the time!

No doubt this result should improve if we choose a larger sample. After
all, while it's true that half of the possible outcomes correctly
reflect the opinions of the electorate, the other half is
way off, telling us there is unanimous sentiment in favor of one candidate.
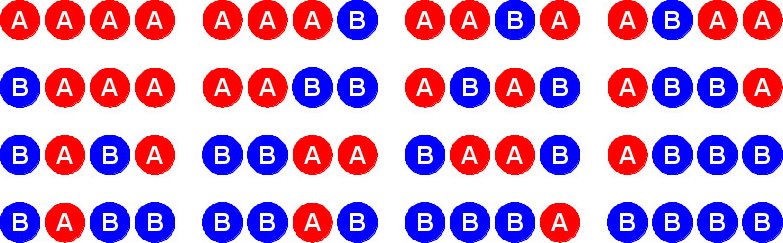
Let's poll four voters this time. There are actually sixteen (2
4) equally likely results:
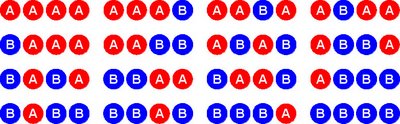
This time, six of the possible sample results (that's three-eighths) are
exactly right in mirroring the fifty-fifty split of the electorate.
What's more, only two of the possible samples (one-eighth of them) tell
us to expect a unanimous vote for one of the candidates. The other
samples (three-eighths of them) give skewed results—giving one candidate
a three-to-one edge over the other—but not as badly skewed as in the
previous two-person sample.
You know what's going to happen as we continue to increase the sample
size: It's going to get more and more difficult to obtain really
unrepresentative results. Let's look at what occurs when we increase the
sample size to just eight randomly selected voters. There are 2
8
= 256 ways the samples can come up, varying from all for A to all for
B. Okay, that's too many cases to write out individually. We'll have to
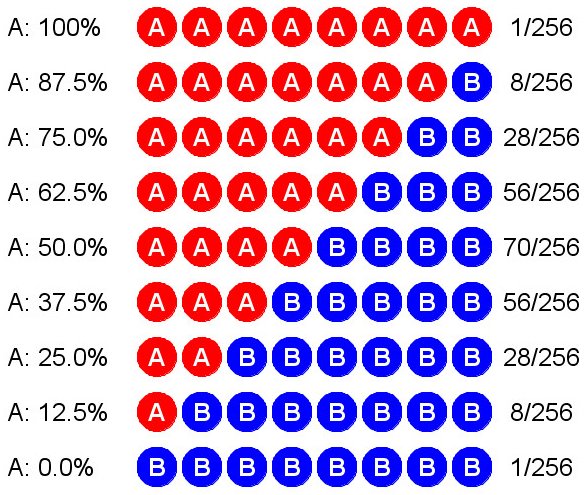
group them. The following table summarizes the possibilities. For
example, there are 28 cases in which we end up with 6 votes for A versus
2 for B. (In case you're curious, these numbers come from
binomial coefficients, made famous in
Pascal's triangle.) Check it out:
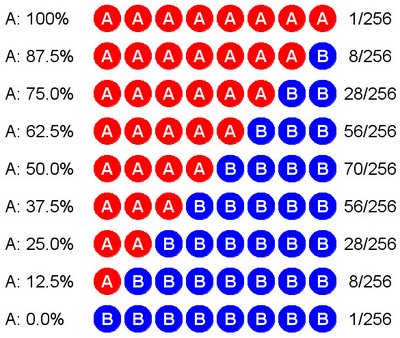
As
you can see, in each case I've given the percentage of supporters for A
found in the sample. There are 56 samples in which A has 62.5% support,
70 in which A has 50% support, and 56 in which A has only 37.5%. In
this little experiment, therefore, we have 56 + 70 + 56 = 182 cases out
of 256 in which A has support between 37.5% and 62.5%. Since 182/256 ≈
71%, that is how often our random sample will indicate that A's support
is between 37.5% and 62.5%. Observe that 37.5% = 50% − 12.5% and 62.5% =
50% + 12.5%. Since we set this up under the assumption that A's true
support is 50%, our poll will be within ±12.5% of the true result about
71% of the time. Mind you, we have no idea in advance which type of
sample we'll actually get when polling the electorate. We're playing the
percentages, which is how it all works.
These results are pretty crude, since professional polls do much better
than ±12.5% only 71% of the time, but we did this by asking only
eight
voters! A real poll would ask a few hundred voters, which suffices to
get a result within ±3% about 95% of the time. That's why pollsters
don't have to ask a majority of the voters their preferences in order to
get results that are quite accurate. A relatively small sample can
produce a solid estimate.
Bigger may be only slightly better
It's unfortunate that more people don't take a decent course in
probability and statistics. That's why most folks are mystified by polls
and can't understand why they work. They
do work, as I've just
shown you, within the limits of their accuracy. Pollsters can measure
that accuracy and publish the limitations of their polls alongside their
vote estimates. Every responsible pollster does this. (Naturally,
everything I say is irrelevant when it comes to biased polls that are
commissioned for the express purpose of misleading people. One should
always treat skeptically any poll that comes directly from a candidate's
own campaign staff.)
The controversy over sample size is constantly hyped by the
statistically ignorant. More than fifty years ago, Phyllis
Schlafly was harping on the same point:
 The unscientific nature of the polls was revealed by Marvin [sic] D. Field,
formerly with the Gallup poll and now head of one of the polls which
picked Rockefeller to beat Goldwater in the California primary, who
admitted to the press that he polled only 256 out of the 3,002,038
registered Republicans in California. He thus based his prediction on
.000085 of Republican voters.
The unscientific nature of the polls was revealed by Marvin [sic] D. Field,
formerly with the Gallup poll and now head of one of the polls which
picked Rockefeller to beat Goldwater in the California primary, who
admitted to the press that he polled only 256 out of the 3,002,038
registered Republicans in California. He thus based his prediction on
.000085 of Republican voters.
While her math is okay,
Schlafly
doesn't know what she's talking about. A sample size of 256 is quite
good and should have produced a reliable snapshot of voter sentiment at
the time the poll was conducted. In addition to getting the pollster's
name wrong (it's Mervin),
Schlafly
neglected to mention that Rockefeller's wife had a baby just before the
California primary, sharply reminding everyone about his controversial
divorce from his first wife. You can't blame a poll for not anticipating
a development like that. Otherwise,
Schlafly's complaint about the poll is based on her ignorance about the sufficiency of sample sizes.
By the way, did you notice that Mervin Field's sample size was a power
of 2? It would have occurred in the natural progression of samples that I
modeled for you in our polling experiment. In my three different
sampling examples, I doubled the sample size each time, going from 2 to 4
to 8, each time getting a significant increase in reliability. If you
keep up the pattern, you get 16, 32, 64, 128, and 256. As you can see,
Field went way beyond my little experiment, doubling my final sample of 8
an additional five times before he was satisfied he would be sampling
enough voters for a good result.
Two caveats
There are a couple of things I should stress about the polling game we
just played. First, of course, in real life we would not know the exact
division of the voters beforehand. That's what we're trying to find out.
It won't usually be something as nice and neat as fifty-fifty. However,
as long as there's a real division between voters (in other words, not
some 90% versus 10% rout), it won't be too difficult to poll enough
voters to get an accurate profile.
Second, even a poll that is supposed to be within its estimated margin of error 95% of the time will be
wrong
and fall outside those bounds 5% of the time. That's one time in
twenty. Therefore, whenever you see a political poll whose results seem
way out of whack, it could be one of those flukes. Remember, polling is
based on probability and statistics: it's accurate in the long run
rather than in every specific instance. In a hot contest where lots of
polls are taken, a candidate's campaign is likely to release only those
polls that show the candidate in good shape. The 5% fluke factor may be
just enough to keep hope alive among those people who believe everything
they read.
Pollsters take their results with a grain of salt, so you should, too. But it's not because of sample size.